
For many ecommerce brands, Cyber Monday is the highest-stress and highest-revenue day of the year. You roll out promotions, set up retargeting, publish ads across multiple platforms, and then hope everything performs.
But what happens after the campaign ends? Did your Cyber Monday campaigns actually work? Which ads drove incremental revenue versus vanity clicks? And how do you prove ROI internally when attribution has become harder than ever?
This is exactly where Cyber Monday analytics and campaign ROI tracking become mission-critical. Brands that cannot measure performance accurately lose money, often in ways they don’t even realize. With rising ad costs and increasingly fragmented customer journeys, every decision needs to be grounded in data.
This guide will break down how to track Cyber Monday success with structured analytics, attribution, and key ecommerce performance KPIs.
Why Cyber Monday Requires a Different Measurement Strategy
Cyber Monday isn’t just a continuation of Black Friday. Customer behavior, channel performance, and attribution patterns shift dramatically. This is why your Cyber Monday analytics framework cannot simply rely on your usual reporting dashboards.
Ecommerce sites see massive traffic spikes; according to Adobe Analytics, U.S. shoppers spent $13.3 billion online on Cyber Monday 2024, a 7.3 % increase over 2023.
Cart abandonment also tends to rise: estimates show the checkout-abandonment rate on Cyber Monday hit more than 80%.
Shopper behavior is deal-driven and multi-touch: one source shows 55% of Cyber Week purchases were explicitly driven by promotions.
Why does this matter for e-commerce analytics?
Last-click attribution will miss the full journey of ads → email → site visit → purchase.
Marketing metrics like Customer Acquisition Cost (CAC) and Return On Ad Spending (ROAS) need context: high volume doesn’t always mean profit unless repeat behavior and LTV are measured.
You’ll need to capture the full funnel, across devices and sessions, to understand incremental value — not just what appears in your final conversion column.
Metric | Typical Month | Black Friday & Cyber Monday Period |
|---|---|---|
Website Traffic | Normal range | High spike |
Conversion Rates | Stable | Highly volatile hour-to-hour |
Customer Intent | Product browsing | Deal-driven, low-friction checkout |
Attribution | Straightforward | Fragmented (multiple touchpoints) |
Core Metrics You Must Track for Cyber Monday Analytics
Below are the essential Black Friday KPIs and Cyber Monday analytics metrics to benchmark performance meaningfully.
1. Conversion Rate (CR)
Conversion Rate = Purchases ÷ Total Sessions
The average ecommerce conversion rate globally sits around 2%–4% , depending on industry and device. And, for peak periods like the Cyber Monday/Black Friday window, conversion rates can jump significantly. For example one report shows conversion rate uplifts of up to +144% during the week versus prior months.
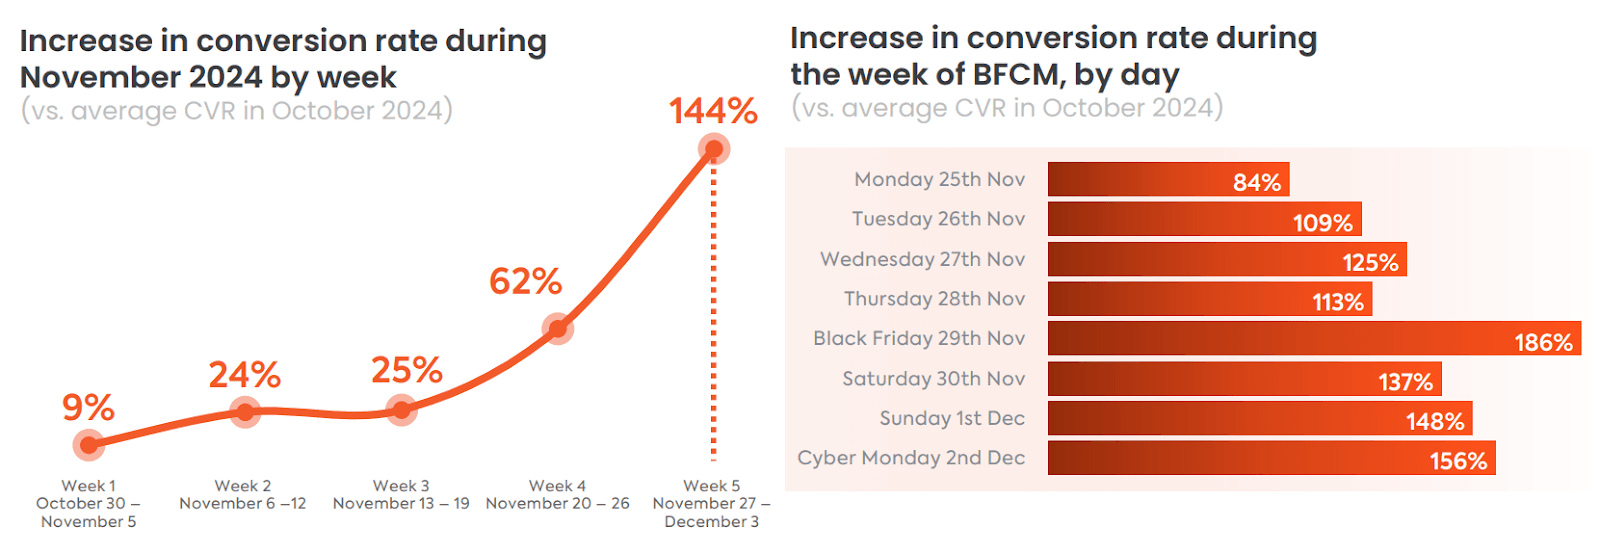
What does this imply? If your conversion rate during Cyber Monday is still in the 1%–2% range, you’re likely under-performing versus market norms.
2. Customer Acquisition Cost (CAC)
Customer Acquisition Cost = Total Spend ÷ New Customers Acquired
Recent e-commerce benchmarks estimate the average CAC at around US $70 for many online retailers, though ranges vary by vertical ($50-$130). Since during a heavy-promo period like Cyber Monday, CAC tends to spike, if your CAC is already high and your repeat value is low, you may be acquiring unprofitable buyers.
3. Return on Ad Spend (ROAS)
Return on Ad Spend = Revenue from Ads ÷ Ad Spend
For ecommerce, a “healthy” ROAS benchmark is generally around 4:1 to 6:1 (i.e., earning $4–$6 in revenue for every $1 spent). So, If your ROAS during a Cyber Monday campaign is under 3:1, you might be spending too much for the return you’re getting — especially given higher costs and higher traffic volume in that period.
4. Average Order Value (AOV)
While industry-wide benchmarks for AOV vary enormously by category so fewer universal figures exist, peak shopping events like Cyber Monday often drive discount pressure and heavier traffic from one-time buyers. So, if your AOV falls below your regular baseline during Cyber Monday, you may be attracting low-value buyers or triggering unnecessary discounting — both of which hurt margin.
For example, during the 2024 Cyber Monday, mobile transactions accounted for 54.8% of customer spending, highlighting the device shift and purchase dynamics.
5. Customer Lifetime Value (LTV)
Customer Lifetime Value = AOV × Purchase Frequency × Customer Lifespan
A healthy LTV:CAC ratio is commonly cited as ~3:1, meaning customers should typically produce about three times what you spend to acquire them.
Following Cyber Week, expect short-term LTV dilution from discount-driven buyers unless you nurture them. Keep in mind that if your Cyber Monday CAC spikes but your projected LTV (30–90 day) doesn’t meet the 3:1 rule of thumb, the campaign likely acquired low-value, promotion-only buyers; prioritize post-purchase upsell, retention flows, and loyalty to improve LTV.
6. Attribution Modeling & Multi-Touch Influence
While not a single numeric benchmark, you need to evaluate performance using multiple attribution lenses:
First-touch: What originally captured interest?
Last-touch: What drove the final purchase?
Multi-touch: Weighted influence
This is where most brands fail. One platform may take credit for 100% of the sale when it only contributed partially.
The Measurement Gap: Why Google Analytics Alone Isn’t Enough
Many brands rely on Google Analytics (GA4) as their primary source of truth, but during high-volume periods like Cyber Monday this creates blind spots.
GA4 can track website behavior and conversions, but it cannot reliably unify data from Shopify purchase history, CRM interactions, email engagement, paid media logs, and cross-device browsing sessions. This means the same customer may appear as multiple separate users across platforms, causing misattributed revenue and misleading performance conclusions.
To measure Cyber Monday performance accurately, brands need a system that stitches identity across channels, merges behavioral and transactional data, and evaluates multi-touch influence. This is the gap a composable CDP like Markopolo is designed to solve — by unifying customer profiles and connecting acquisition, activation, and retention into one continuous data layer.
Step-by-Step: Setting Up Cyber Monday Analytics Tracking
Step 1: Define Your Core Metrics & Benchmarks
Decide which KPIs will determine success (e.g., CAC, ROAS, AOV, CR, LTV). Set pre-Cyber-Monday baselines so you can compare performance instead of guessing.
Step 2: Set Up Clean Conversion Tracking
Ensure GA4, your ad platforms (Meta/Google), and your e-commerce platform (e.g., Shopify/WooCommerce) are correctly tracking purchase conversions. Confirm events like Add to Cart, Checkout Start, and Purchase trigger accurately before campaign launch.
Step 3: Configure Attribution Views
Use more than one attribution model. Compare last-click, first-click, and data-driven attribution to understand which touchpoints assisted vs. closed conversions.
Step 4: Segment Your Audiences
Group users into meaningful segments such as:
First-time visitors
Returning customers
Cart abandoners
High-intent product viewers
This lets you evaluate which audiences responded to Cyber Monday offers.
Step 5: Track Spend and Revenue by Channel in Real Time
Monitor performance hourly during Cyber Monday instead of waiting until the next day. Quick adjustments to bids, budgets, or offers can prevent wasted spend.
Step 6 — Record Both Revenue AND Margin
Promotions can inflate revenue but shrink profit. Track gross margin per order alongside total revenue to avoid misleading “big sales day” celebrations.
Post-Cyber Monday Analysis: What to Evaluate
After the campaign, move beyond revenue totals and look at performance patterns.
1. Did You Attract the Right Customers?
Compare new customer behavior against returning customers. If new buyers have a much lower AOV or no repeat purchases, discounting may have attracted one-time deal hunters.
2. Which Channels Assisted the Most Sales?
Review multi-touch paths in GA4. If prospecting and email played early-stage roles, don’t underfund them just because last-click credit went to branded search.
3. How Did Customer Acquisition Cost Change?
Compare CAC during Cyber Monday to your regular CAC. A CAC that doubled while LTV stayed flat suggests unsustainable growth.
4. What Happened to AOV and Profit Margin?
High revenue with lower margin may mean the discount was too aggressive. Evaluate whether the trade-off was worth it.
5. Did Repeat Purchase Rates Improve?
Check 14-day, 30-day, and 60-day repurchase curves. This determines whether Cyber Monday buyers are becoming loyal customers or simply taking the deal and leaving.
Final Thoughts
The goal isn’t just high revenue on Cyber Monday — it’s profitable growth. Track the right metrics, evaluate buyer quality, and understand which channels truly drive conversions. When your data tells the story clearly, your decisions become sharper and your campaigns become repeatable.
Ready to apply these insights to your campaigns? Reach out and let’s build it together!
"/><stop offset="1" stop-color="rgba(0, 0, 0, 0)"/></linearGradient></defs><path d="M 118.813 12.145 C 119.259 11.646 119.758 11.228 120.312 10.892 C 121.232 10.339 122.33 10.064 123.605 10.064 C 124.96 10.064 126.149 10.319 127.175 10.832 C 128.213 11.345 129.081 12.081 129.778 13.041 C 130.488 13.988 131.021 15.125 131.376 16.453 C 131.731 17.781 131.908 19.253 131.908 20.87 L 131.908 21.284 C 131.908 22.836 131.731 24.276 131.376 25.604 C 131.021 26.931 130.495 28.088 129.798 29.074 C 129.101 30.06 128.234 30.83 127.195 31.382 C 126.17 31.921 124.979 32.19 123.625 32.19 C 122.35 32.19 121.252 31.908 120.332 31.343 C 119.769 30.997 119.263 30.569 118.813 30.061 L 118.813 40 L 112.167 40 L 112.167 10.064 L 118.813 10.064 Z M 44.55 10.021 C 46.107 10.021 47.496 10.28 48.716 10.8 C 49.947 11.319 50.92 12.099 51.633 13.139 C 52.345 14.166 52.701 15.459 52.701 17.018 L 52.701 25.048 C 52.701 26.329 52.774 27.302 52.919 27.967 C 53.064 28.62 53.269 29.864 53.534 30.359 L 47.481 30.359 C 47.24 29.856 47.001 29.008 46.844 28.235 C 46.64 28.489 46.413 28.732 46.162 28.963 C 45.715 29.374 45.166 29.713 44.514 29.979 C 43.862 30.232 43.07 30.359 42.141 30.359 C 40.933 30.359 40.141 30.112 39.127 29.616 C 38.125 29.121 37.322 28.432 36.718 27.55 C 36.114 26.656 35.813 25.628 35.813 24.468 C 35.813 23.453 35.994 22.547 36.356 21.749 C 36.731 20.952 37.291 20.275 38.04 19.719 C 38.789 19.163 39.424 18.74 40.583 18.45 C 41.742 18.16 43.107 18.015 44.677 18.015 L 46.56 18.015 L 46.56 16.981 C 46.56 16.426 46.482 15.949 46.325 15.55 C 46.168 15.151 45.921 14.843 45.583 14.625 C 45.245 14.396 44.792 14.28 44.225 14.28 C 43.766 14.28 43.373 14.36 43.047 14.517 C 42.721 14.674 42.473 14.909 42.304 15.224 C 42.135 15.538 42.051 15.937 42.051 16.42 L 35.946 16.42 C 35.946 15.514 36.146 14.674 36.544 13.9 C 36.955 13.115 37.535 12.432 38.283 11.852 C 39.044 11.272 39.95 10.825 41 10.511 C 42.063 10.185 43.246 10.021 44.55 10.021 Z M 20.333 16.818 L 20.333 10.064 L 27.391 10.064 L 33.96 16.824 L 33.96 30.357 L 27.391 30.357 L 27.391 16.824 L 20.338 16.824 L 20.338 30.357 L 13.77 30.357 L 13.77 16.824 L 6.712 16.824 L 6.712 30.357 L 0 30.357 L 0 16.824 L 6.712 16.824 L 6.712 10.064 L 13.77 10.064 Z M 66.509 10.021 C 66.837 10.021 67.159 10.041 67.475 10.08 C 67.803 10.12 68.093 10.179 68.343 10.258 L 68.225 16.431 C 67.962 16.404 67.606 16.372 67.159 16.332 C 66.712 16.293 66.338 16.273 66.035 16.273 C 65.26 16.273 64.589 16.365 64.023 16.549 C 63.471 16.72 63.012 16.983 62.644 17.338 C 62.394 17.578 62.191 17.864 62.032 18.194 L 62.032 30.328 L 55.386 30.328 L 55.386 10.08 L 62.032 10.08 L 62.032 12.789 C 62.046 12.767 62.058 12.745 62.071 12.723 C 62.597 11.855 63.235 11.191 63.984 10.731 C 64.734 10.257 65.575 10.021 66.509 10.021 Z M 100.855 9.999 C 102.399 9.999 103.757 10.252 104.927 10.759 C 106.109 11.254 107.098 11.948 107.895 12.842 C 108.691 13.735 109.294 14.791 109.704 16.011 C 110.114 17.218 110.319 18.54 110.319 19.977 L 110.319 20.356 C 110.319 21.781 110.114 23.103 109.704 24.322 C 109.294 25.529 108.691 26.586 107.895 27.491 C 107.098 28.384 106.114 29.078 104.944 29.573 C 103.774 30.068 102.423 30.315 100.892 30.315 C 99.359 30.315 98.002 30.068 96.819 29.573 C 95.637 29.078 94.649 28.384 93.852 27.491 C 93.056 26.586 92.453 25.529 92.043 24.322 C 91.633 23.103 91.428 21.781 91.428 20.356 L 91.428 19.977 C 91.428 18.54 91.633 17.218 92.043 16.011 C 92.453 14.791 93.056 13.735 93.852 12.842 C 94.649 11.948 95.632 11.254 96.802 10.759 C 97.972 10.252 99.323 9.999 100.855 9.999 Z M 143.199 9.999 C 144.743 9.999 146.1 10.252 147.271 10.759 C 148.453 11.254 149.442 11.948 150.238 12.842 C 151.034 13.735 151.638 14.791 152.048 16.011 C 152.458 17.218 152.663 18.54 152.663 19.977 L 152.663 20.356 C 152.663 21.781 152.458 23.103 152.048 24.322 C 151.638 25.529 151.034 26.586 150.238 27.491 C 149.442 28.384 148.459 29.078 147.289 29.573 C 146.119 30.068 144.767 30.315 143.235 30.315 C 141.703 30.315 140.346 30.068 139.164 29.573 C 137.982 29.078 136.992 28.384 136.196 27.491 C 135.4 26.586 134.797 25.529 134.387 24.322 C 133.977 23.103 133.771 21.781 133.771 20.356 L 133.771 19.977 C 133.771 18.54 133.977 17.218 134.387 16.011 C 134.797 14.791 135.4 13.735 136.196 12.842 C 136.992 11.948 137.975 11.254 139.146 10.759 C 140.316 10.252 141.667 9.999 143.199 9.999 Z M 172.449 9.999 C 173.993 9.999 175.35 10.252 176.521 10.759 C 177.703 11.254 178.692 11.948 179.488 12.842 C 180.284 13.735 180.888 14.791 181.298 16.011 C 181.708 17.218 181.913 18.54 181.913 19.977 L 181.913 20.356 C 181.913 21.781 181.708 23.103 181.298 24.322 C 180.888 25.529 180.284 26.586 179.488 27.491 C 178.692 28.384 177.709 29.078 176.539 29.573 C 175.369 30.068 174.017 30.315 172.485 30.315 C 170.953 30.315 169.596 30.068 168.414 29.573 C 167.232 29.078 166.242 28.384 165.446 27.491 C 164.65 26.586 164.047 25.529 163.637 24.322 C 163.227 23.103 163.021 21.781 163.021 20.356 L 163.021 19.977 C 163.021 18.54 163.227 17.218 163.637 16.011 C 164.047 14.791 164.65 13.735 165.446 12.842 C 166.242 11.948 167.225 11.254 168.396 10.759 C 169.566 10.252 170.917 9.999 172.449 9.999 Z M 161.166 30.313 L 154.5 30.313 L 154.5 0.021 L 161.166 0.021 Z M 76.845 16.077 L 77.515 15.205 L 81.612 10.073 L 89.579 10.073 L 82.959 17.81 L 89.579 30.311 L 81.967 30.311 L 78.53 22.531 L 76.845 24.218 L 76.845 30.311 L 70.198 30.311 L 70.198 0 L 76.845 0 Z M 121.949 15.19 C 121.239 15.19 120.641 15.303 120.154 15.526 C 119.681 15.737 119.3 16.065 119.011 16.512 C 118.94 16.623 118.874 16.743 118.813 16.869 L 118.813 25.284 C 119.04 25.75 119.348 26.133 119.74 26.432 C 120.292 26.852 121.042 27.063 121.988 27.063 C 122.619 27.063 123.146 26.918 123.566 26.629 C 123.987 26.327 124.323 25.913 124.572 25.387 C 124.822 24.848 124.999 24.23 125.104 23.533 C 125.21 22.836 125.262 22.086 125.262 21.284 L 125.262 20.87 C 125.262 20.042 125.203 19.286 125.085 18.603 C 124.967 17.906 124.776 17.301 124.513 16.788 C 124.263 16.275 123.928 15.881 123.507 15.605 C 123.086 15.329 122.567 15.191 121.949 15.19 Z M 44.641 21.277 C 44.073 21.277 43.59 21.357 43.191 21.514 C 42.805 21.671 42.491 21.888 42.25 22.166 C 42.021 22.432 41.851 22.734 41.742 23.072 C 41.646 23.411 41.598 23.767 41.598 24.142 C 41.598 24.504 41.683 24.83 41.852 25.12 C 42.033 25.398 42.274 25.616 42.576 25.773 C 42.878 25.93 43.216 26.009 43.59 26.009 C 44.266 26.009 44.84 25.882 45.31 25.628 C 45.794 25.362 46.162 25.042 46.416 24.667 C 46.47 24.587 46.518 24.507 46.56 24.429 L 46.56 21.277 Z M 100.855 14.707 C 100.216 14.707 99.679 14.846 99.245 15.123 C 98.823 15.401 98.485 15.787 98.231 16.282 C 97.978 16.765 97.797 17.326 97.688 17.966 C 97.58 18.594 97.525 19.264 97.525 19.977 L 97.525 20.356 C 97.525 21.093 97.58 21.781 97.688 22.421 C 97.797 23.061 97.978 23.622 98.231 24.104 C 98.485 24.575 98.828 24.943 99.263 25.209 C 99.697 25.475 100.24 25.607 100.892 25.607 C 101.531 25.607 102.061 25.474 102.483 25.209 C 102.918 24.943 103.262 24.575 103.516 24.104 C 103.769 23.622 103.95 23.06 104.059 22.421 C 104.167 21.781 104.221 21.093 104.221 20.356 L 104.221 19.977 C 104.221 19.264 104.167 18.594 104.059 17.966 C 103.95 17.326 103.769 16.765 103.516 16.282 C 103.262 15.787 102.918 15.401 102.483 15.123 C 102.049 14.846 101.507 14.707 100.855 14.707 Z M 143.199 14.707 C 142.56 14.707 142.023 14.845 141.589 15.123 C 141.167 15.401 140.829 15.787 140.575 16.282 C 140.322 16.765 140.141 17.326 140.032 17.966 C 139.924 18.594 139.869 19.264 139.869 19.977 L 139.869 20.356 C 139.869 21.093 139.924 21.781 140.032 22.421 C 140.141 23.061 140.322 23.622 140.575 24.104 C 140.828 24.575 141.172 24.943 141.606 25.209 C 142.041 25.475 142.584 25.607 143.235 25.607 C 143.875 25.607 144.405 25.474 144.827 25.209 C 145.261 24.943 145.606 24.575 145.859 24.104 C 146.113 23.622 146.294 23.06 146.402 22.421 C 146.511 21.781 146.564 21.093 146.564 20.356 L 146.564 19.977 C 146.564 19.264 146.511 18.594 146.402 17.966 C 146.294 17.326 146.113 16.765 145.859 16.282 C 145.606 15.787 145.261 15.401 144.827 15.123 C 144.393 14.846 143.85 14.707 143.199 14.707 Z M 172.449 14.707 C 171.81 14.707 171.273 14.845 170.839 15.123 C 170.417 15.401 170.079 15.787 169.825 16.282 C 169.572 16.765 169.391 17.326 169.282 17.966 C 169.174 18.594 169.119 19.264 169.119 19.977 L 169.119 20.356 C 169.119 21.093 169.174 21.781 169.282 22.421 C 169.391 23.061 169.572 23.622 169.825 24.104 C 170.078 24.575 170.422 24.943 170.856 25.209 C 171.291 25.475 171.834 25.607 172.485 25.607 C 173.125 25.607 173.656 25.474 174.078 25.209 C 174.512 24.943 174.856 24.575 175.109 24.104 C 175.363 23.622 175.544 23.06 175.652 22.421 C 175.761 21.781 175.814 21.093 175.814 20.356 L 175.814 19.977 C 175.814 19.264 175.761 18.594 175.652 17.966 C 175.544 17.326 175.363 16.765 175.109 16.282 C 174.856 15.787 174.512 15.401 174.078 15.123 C 173.644 14.845 173.101 14.707 172.449 14.707 Z M 3.181 10.064 C 3.279 10.881 3.572 11.608 4.156 12.195 C 4.741 12.789 5.456 13.117 6.294 13.232 C 5.473 13.359 4.756 13.67 4.174 14.261 C 3.586 14.854 3.279 15.577 3.178 16.412 C 3.062 15.577 2.756 14.845 2.16 14.252 C 1.567 13.659 0.841 13.339 0 13.247 L 0 13.244 C 1.841 12.953 2.881 11.893 3.181 10.064 Z" fill="url(%23cN2V3Wxam-866808648-linear-gradient)" height="40.00000040435791px" id="cN2V3Wxam" width="181.91299609375002px"/></svg>)
